The following analysis of the Salt Lake County real estate market is provided by Windermere Real Estate Principal Economist Jeff Tucker. We hope that this information may assist you with making better-informed real estate decisions.
ECONOMIC OVERVIEW
At the start of the second quarter, new geopolitical turmoil threatened to derail an expected rebound in housing market activity. The disruptions to energy markets and supply chains caused by the Iran war drove both inflation and interest rates up sharply. Mortgage rates averaged 6.41% over the entire quarter, erasing the welcome declines observed in the winter.
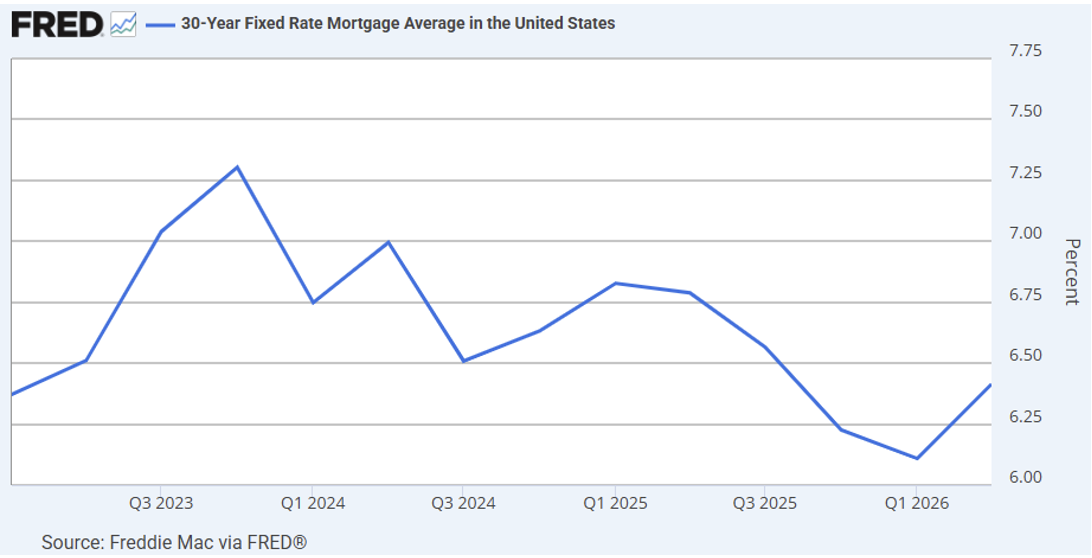
Source: Freddie Mac via FRED.
The war in Iran also reversed the past winter’s modest improvements in consumer sentiment, according to the University of Michigan’s Consumer Sentiment Survey.
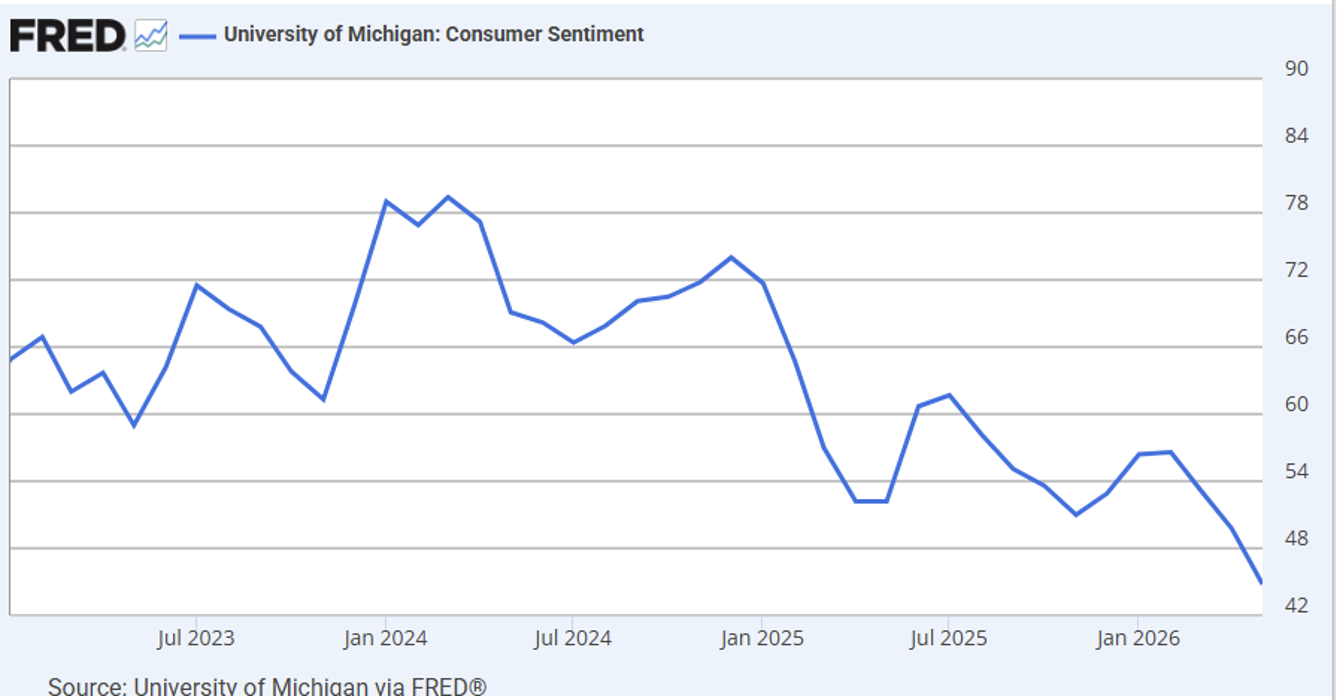
Source: University of Michigan via FRED.
Remarkably (but less remarked upon), the labor market decisively improved in the first half of the year: employment levels reversed the stall seen in late 2025, posting solid gains throughout the spring, while job openings turned up in April and May. The stock market also posted strong year-to-date gains of nearly 10% by midyear, shaking off initial declines at the outbreak of the war.
In the final tally, the balance of macroeconomic tailwinds and headwinds did not send the housing market back into hibernation. The spring selling season saw time on market drop while sales climbed from the first quarter, following the seasonal trends that we see almost every year. Sales also increased year over year across most of the regions in this report, although they dipped slightly around the Seattle area. After two straight springs marked by geopolitical disruptions, there’s reason to hope that a quieter summer and fall leading into the midterm elections will provide the foundation for strong sales activity in the second half of 2026, especially if inflation cools and mortgage rates ease.
Active Listings
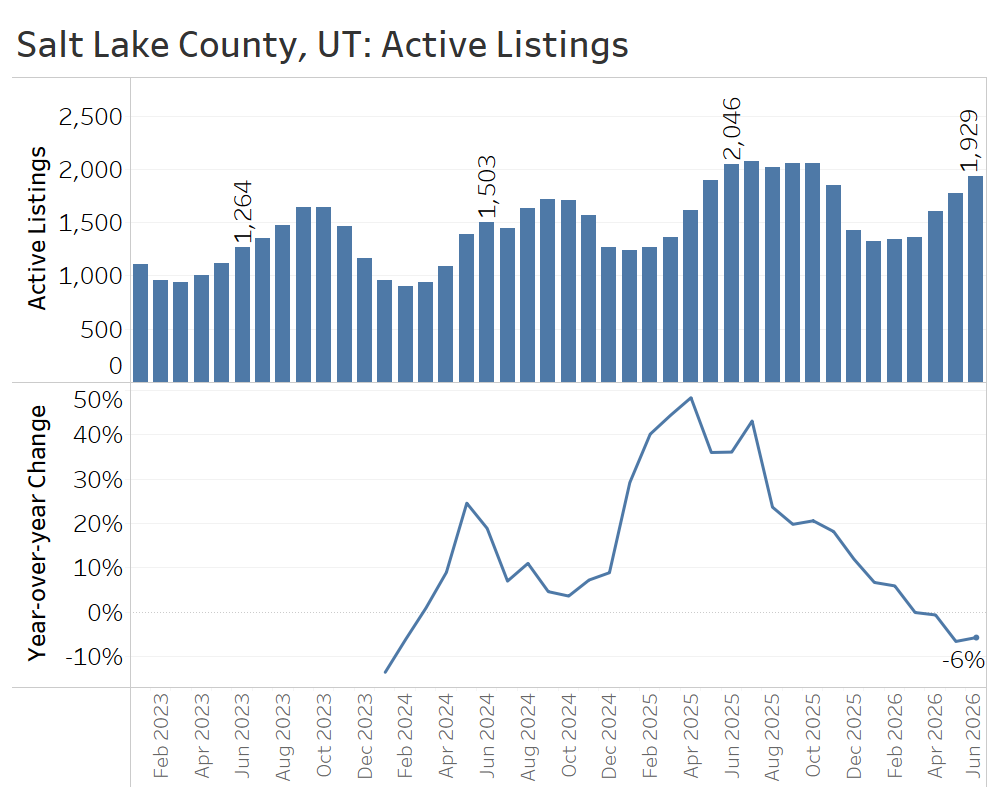
In the second quarter of 2026, the Salt Lake County market continued to show stronger sales activity than many of its peer markets, and inventory began to decline modestly.
Active listings ended the month of June 6% below year-ago levels, decisively closing the door on the prior two years of inventory buildup.
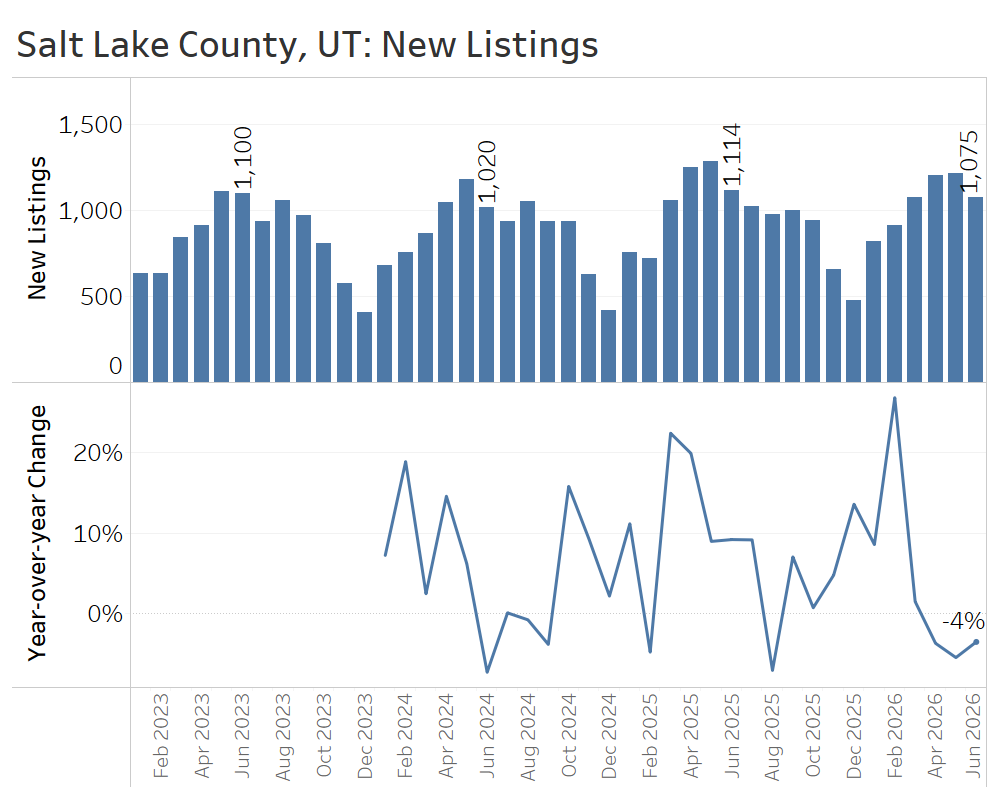
The reversal of inventory growth could be explained in part by the sudden dropoff of new listings. All told, the flow of new listings hitting the market declined by 4% from the same quarter last year.
Median Sold Price
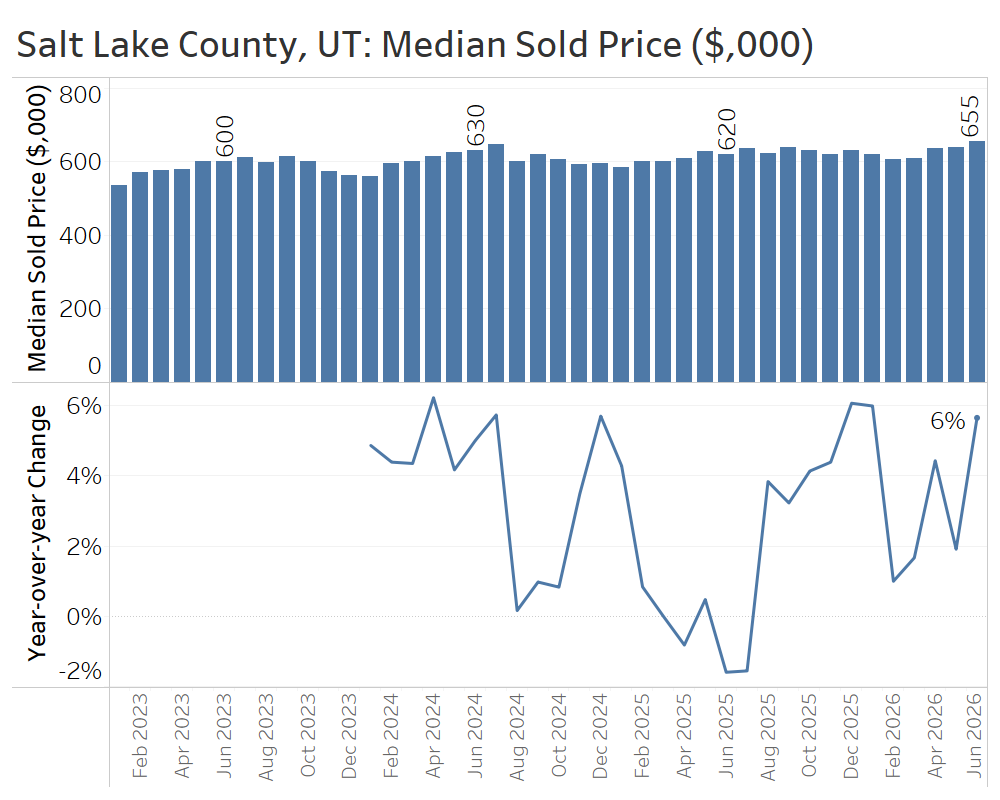
Median sale prices continued to post year-over-year gains through June, with stronger growth later in the quarter but lots of month-to-month noise.
New Listings
The reversal of inventory growth could be explained in part by the sudden dropoff of new listings. All told, the flow of new listings hitting the market declined by 4% from the same quarter last year.
Closed Sales
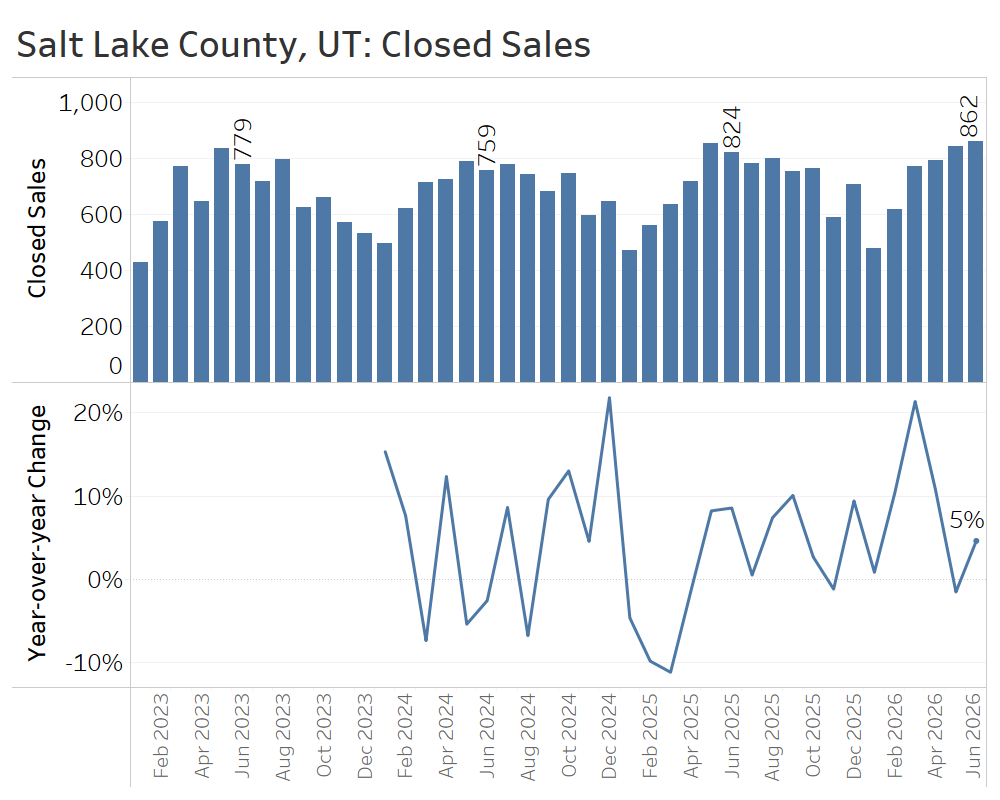
Closed home sales over the second quarter were 5% higher than the same period in 2025, continuing the rebound in buyer activity that began earlier in the year.
Days on Market
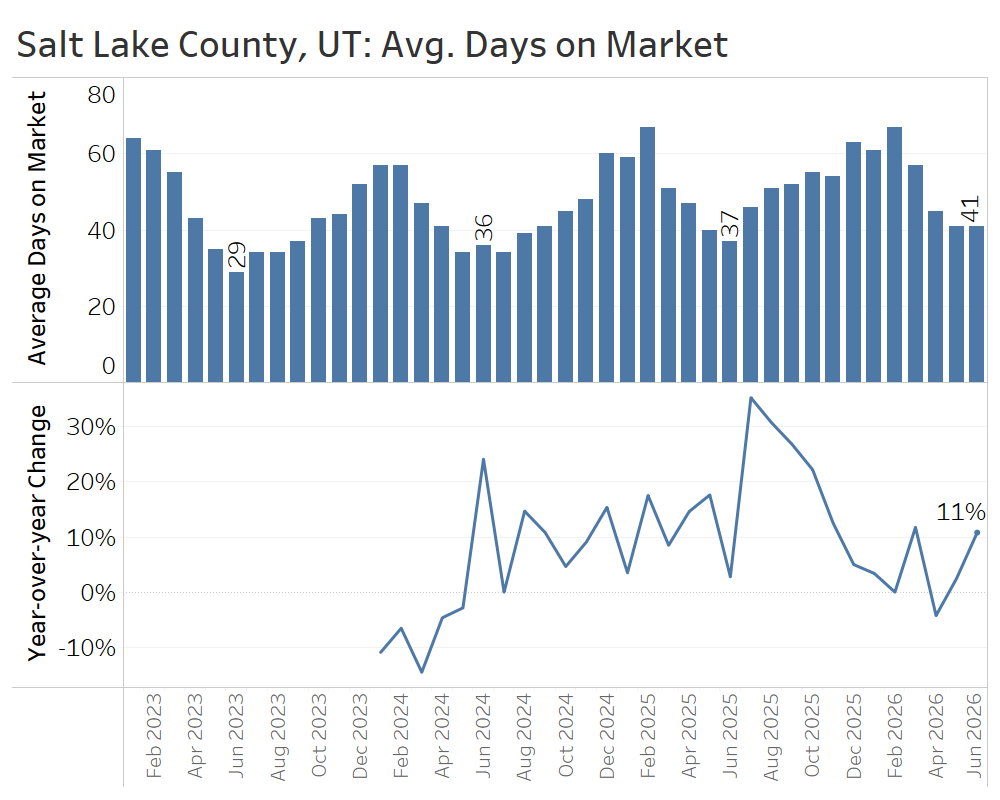
Days on market declined seasonally into the second quarter, but by the end of the quarter they remained near, or slightly above, year-ago levels. This shows the market is not decisively swinging in buyers’ favor.
CONCLUSIONS
Salt Lake County’s second-quarter market saw a healthy turn toward more sales activity without breakneck sale speeds. The decline in active listings, coupled with rising price appreciation, could suggest the beginning of a seller-friendly phase, but third-quarter data will help distinguish whether this is just a blip or a real inflection point turning back toward a seller’s market.
Through mid-2026, the housing market proved remarkably resilient to the shock of rising mortgage rates and geopolitical turmoil. All of the markets highlighted in this report saw the usual spring lift in demand, and many outpaced year-ago comparisons. Conditions generally favored neither buyers nor sellers decisively, but the balance varied meaningfully by region. The Seattle area is still grappling with rising inventory and declining sales, while most of the other regions in this report have begun to turn the corner into a phase of flat-to-falling inventory coupled with growing sales.
These subtle shifts between buyer-friendly and more balanced conditions are making for a complex market to predict. Buyers will find more options and more room to negotiate in inventory-heavy areas, while still facing affordability constraints from elevated borrowing costs. Sellers need to recognize that a seasonal increase in buyer traffic does not guarantee multiple offers or rapid price appreciation, but many will still sell quickly with the right list price and positioning.
As the third quarter begins, it will be crucial for anyone trying to buy or sell a home to track local trends with the help of a skilled real estate professional. The ceasefire in Iran and easing inflation could bring more buyers into the market who sat out the spring, while sellers may become more motivated to sell rather than wait to re-list next spring. Summer is the least predictable season in the housing market, and this year looks to be no exception.
Sources: TrendGraphix analysis of NWMLS, RMLS, Spokane MLS, Coeur d’Alene MLS, MetroList MLS, and Wasatch Front MLS data. All charts are restricted to single-family residential home listings and sales.
About Jeff Tucker
As Principal Economist for Windermere Real Estate, Jeff Tucker is responsible for analyzing and interpreting economic data and its impact on the real estate market on both a local and national level. Jeff has over 10 years of experience as an economist at companies such as Zillow, Amazon, and AirDNA.


Webb Real Estate Group is not a Real Estate Brokerage. Webb Real Estate Group is a Real Estate Team under the Brokerage Windermere Real Estate.
©2025 Windermere Real Estate